
Minimizing costs maximizes our impact for the world’s poorest: in a million-dollar GiveDirectly program, increasing efficiency from 75% to 80% might allow us to give an additional 100 people cash.1 But efficiency is not the only important metric, as some higher-cost programs reach more vulnerable populations or unlock new funds to go directly to people in poverty.
In our aim to better communicate these trade-offs, this blog explains (i) the costs of delivering your donations, (ii) how those costs have evolved over time, (iii) our perspective on what is a ‘good’ efficiency for our programs, and (iv) reasons for a recent drop in our Africa poverty relief programs’ efficiencies.
In the past, we aimed to keep our costs to ~10% org-wide
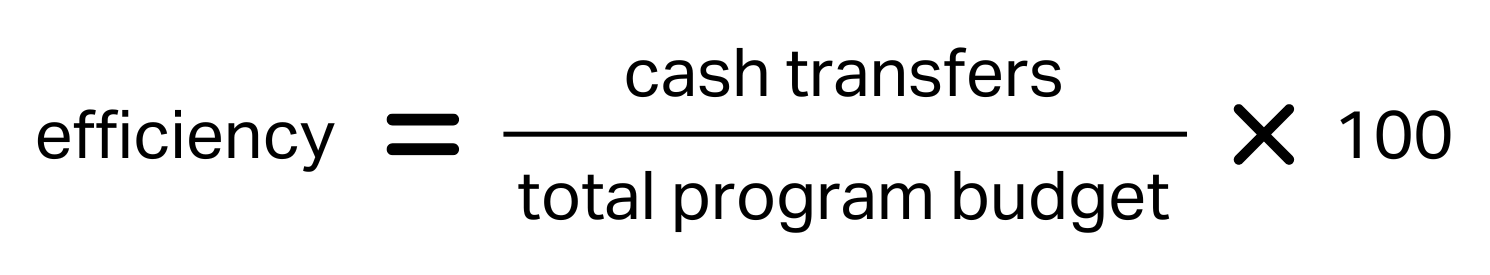
We calculate our efficiency as the percent of your donation that gets in the hands of recipients after all operational costs (i.e. transaction fees, offices, and staff both on the ground and those supporting globally).
GiveDirectly’s flagship poverty relief program –– giving ~$1,000 to families in stable regions of Africa –– were the primary way we delivered donations in our first decade of work (2009-2019).
We targeted a ~90% efficiency based on how we’d performed in our first years of operations. This was not a strict internal goal, but rather roughly what we thought we could deliver. Some programs might have lower or higher costs, but we aimed to average out at ~90%.
We shared our efficiency as a single, org-wide number because, early on, we mostly ran this flagship program. Over time, we piloted programs with different designs:
- 2017: launched a Kenyan basic income study and a U.S. hurricane response.
- 2018: launched a study in Uganda giving cash to refugees in a settlement
- 2019: launched another refugee program in Rwanda and a Bahamas hurricane response
But even by the end of the decade, 82% of funds were going to our flagship programs, so we decided to keep calculating efficiency as a single org-wide number and target.
We expanded significantly in response to COVID-19, making our old cost target less useful
The COVID-19 pandemic prompted a rapid and urgent transformation of our work. In the two year period of 2020 to 2021, GiveDirectly…
- received 5.6x more donations than the previous two years ($544M vs. $97M)
- delivered three-quarters of our funds as emergency relief (mostly to Americans), and just a quarter through our original flagship program
- launched 25 new programs and reached recipients in 10 countries, compared to 10 new programs and 7 countries in the previous two years
A single org-wide efficiency (the red dashed line) tells you an oversimplified view of how we’re performing, as the underlying work had become far more complex, including a $200M U.S. pandemic relief project (in blue).
In our new steady-state, we’re delivering donations across four main types of programs
Today, we’re delivering more cash through more types of programs, each with different designs, goals, and efficiencies. These fall into four buckets:
■ Flagship poverty relief: large lump sums to Africans in extreme poverty in stable regions
■ Bespoke poverty relief: cash to Africans in poverty with unique designs (targeting, transfer size, coordinating with other interventions, etc.)
■ Global emergency relief: cash to people impacted by crises in Africa and elsewhere2
■ U.S. cash assistance: cash to low-income Americans – read why we work in the U.S. →
Note: going forward, all donations made to “Poverty relief – Africa” only go to our high-efficiency flagship poverty relief programs, not all our African programs as they did before.
Our newer African programs help reach more people in poverty and bring in new funding, but cost more to deliver –– a worthwhile tradeoff
As you see above, about a third of our Africa budget goes to programs other than our flagship, including
- $105 to families in rural Nigeria ahead of predicted floods and $210 after floods →
- $410 plus two years of $40/month for food-insecure families impacted by conflict in the D.R.C. →
- $740 to refugees living in urban Nairobi, Kenya →
…just to name a few of the dozen running on the continent. That diversity is intentional. We’re designing cash programs to reach specific, vulnerable communities our flagship program is not able to reach.
This is necessary if we’re going to accelerate the end of extreme poverty with direct cash. There are 18M+ refugees in sub-saharan Africa, and by 2030, about two of every three people in extreme poverty will be in fragile or conflict-affected countries, not the stable ones where we first started. To further our mission –– even if it costs more –– we need to be able to reach them too.
Our strategy is to grow the pie of donors giving directly and thus dollars in the hands of recipients
Also, these bespoke programs result in more money going directly to people living in extreme poverty. Since 2022, half of our ~$170M/year budget comes from private philanthropy. The other half comes from aid agencies or institutions, many of whom care first about reaching the most vulnerable populations and accept the higher costs required to do this safely.
If you donate to “where most needed,” one of the ways we might use your money is to fund these new programs, while also unlocking even more money from aid agencies and institutions. You can read an example of how this works below – we’ve unlocked $114M in new, incremental donations this way.3
Read how a higher-cost program kicked off a partnership that raised $17.5M for recipients →
While these bespoke programs may cost more to deliver, they’re putting millions of additional dollars into the hands of people in poverty that would otherwise not have reached them. They also help make the case to USAID, America’s aid agency with a $60B/year budget, to advocate for direct cash more broadly, potentially changing the wider aid sector.
Now, we set efficiency targets for each program type, rather than org-wide
To better reflect our more diverse set of programs, we now track and target efficiency by program type. This gives you more insight into how we’re doing. Instead of collapsing our diverse work into one org-wide number, you can judge how well we’re doing by each type of program.
Click to expand and read how we set each target
~85% for our flagship poverty relief programs
~75% for bespoke poverty relief programs
~60% for global emergency relief programs
No single efficiency target for U.S. programs as the work varies widely
We may adjust these efficiency targets as our costs change over time. If we do, we’ll provide an update on our thinking.
We’ve also made two changes in how we calculate efficiency.
We now calculate by dollars “delivered” instead of “committed” to recipients
We stopped including currency valuation changes in efficiency
Here’s how we’re performing against those revised targets
Our programs’ efficiencies dropped, and we have a plan to improve
As you see above, our flagship poverty relief efficiency dropped from 82% at the end of 2022 to 68% a year later, and is at ~72% today. Our bespoke poverty relief efficiency was also below target until recently.
This was mostly because we found it difficult to predict exactly where our ‘new normal’ for donations and operations would be following our dramatic expansion during COVID-19 — a challenge faced by many nonprofits. We were trying to strike the balance between delivering existing funds to recipients, retaining our core staff, and predicting future funding, all during an unprecedented period for fundraising.
Read about the operational setbacks that drove up our costs and our plan to fix each5
📉 Predicting revenue
📈 Controlling costs
🌍 Country expansion
🏛️ Government coordination
🇨🇩 Pausing operations in DRC
These improvements have been underway for the past year. However, our flagship program’s efficiency is still below target, as these changes take time to create impact. Based on our current plans, we expect to be back at a level we’re comfortable with in 2025.
Our flagship programs continue to be one of the world’s most cost-effective and impactful poverty interventions. In fact, the charity evaluator GiveWell more than tripled their estimates of our cost-effectiveness this year after reevaluating our work, including assessing new evidence.
Expect more updates on our costs and programs soon
Here’s what to look for in the future from us on this topic:
- 📊 Our annual reporting each November with the release of the previous year’s audited financials and tax statements.
- 📈 Updates on how the improvements described above have increased the efficiency of all our Africa-based programs –– including our flagship –– over time.
- 🗂️ Further refinement in how we bucket our program into types and their respective target efficiencies. The more cash we deliver, the more we learn about the expected costs of high-impact work.
If you want to know more about our efficiency, visit GiveDirectly.org/financials or write to us at [email protected].
We’re aiming to accelerate the end of extreme poverty while remaining cost-effective
GiveDirectly started as a small organization with a big goal: accelerate the end of extreme poverty globally with cash transfers. Our more complex set of programs today is a sign of progress towards that goal.
With each phase of growth, we expect a bit of strategy refinement, adjusting targets and correcting course. Keeping our costs low is key to accomplishing our big goal as it allows us to reach more people in need.
We appreciate your continued support in our mission and for your trust in people in poverty.